
One of the most burdensome things for a transportation business owner is the vague fear that "you never know when or where an accident will happen." However, official statistics from the National Police Agency show that accidents do not happen randomly.
If you categorize traffic accidents in 2023 by the type of violation, 56.1% fell under the category of failure to comply with safety obligations. All other types of violations combined make up less than 44%.
What does this statistic mean for transportation business owners? This article answers three questions based on data from the National Police Agency's Traffic Accident Analysis System (TAAS).
- What types of violations are most often associated with accidents?
- What specific driving behaviors are associated with impaired driving?
- How can we stop those behaviors?
What violations go hand-in-hand with accidents - 56.1% safety violations
Here are the traffic accident statistics by violation in 2023 from the National Police Agency's Traffic Accident Analysis System (TAAS), which categorizes traffic accidents by the type of violation at the time of the accident.

56.1% of all traffic accidents fall into the Safety Failure category. All other violation types combined make up less than 44%, meaning that one category is greater than the sum of all others.
A question naturally follows from this. What specifically does "Safety Failure" mean?
According to Article 48 of the Road Traffic Law, a violation of the duty of care (violation of the duty to drive safely) means that the driver does not operate the vehicle correctly, or drives in a way that is incompatible with traffic conditions and vehicle performance and may endanger others. It is a type of violation that results from the driver's carelessness, lack of concentration, or driving behavior,rather than a violation of a law that specifies a specific act, such as running a red light or crossing the center line.
Safety Failure is a matter of driver behavior
The phrase "safety failure" sounds abstract. But when you look at the breakdown, they are all clearly driver behavior.
| Safety violation breakdown | Percentage |
|---|---|
| Drowsy driving | 47.8 |
| Rapid lane changes (aggressive driving) | 33.5 |
| Sudden acceleration and stopping | 6.7 |
| Sharp left/right turn | 5.8 |
| Cell phone use | 2.9 |
| Not looking ahead | 2.9 |
| Smoking | 0.3 |
| Other (drug use, etc.) | 0.1 |
Source: National Police Agency Traffic Accident Analysis System (TAAS)
As you can see from the table above, drowsy driving and reckless driving together account for 81.3%of safety failures.
If we go one step further, we see an important fact. All eight of these behaviors are specific actions that drivers are taking in real time. They're not abstract obligations to "stay alert" - they're objectively observablebehaviors likewhether you're dozing off, looking at your phone, or not looking ahead.
Here's the most important tipping point for transportation business owners in interpreting these statistics correctly. Accidents happen with "behavior," not "luck," and those behaviors are objectively observable.

These accidents are completely preventable
The most important implication of the statistics in the previous section is aside.
It is that the behaviors that accompany more than half of the accidents are all within the company's awareness and control.
There's a common perception in fleet safety management - "Driving is the driver's job, after all, and we can't control it" - but the structure of crash-associated behaviors shown by the National Highway Traffic Safety Administration data flies in the face of this perception.
Risky behavior can be objectively detected
The driver behaviors that constitute safety failures are all technically detectable.
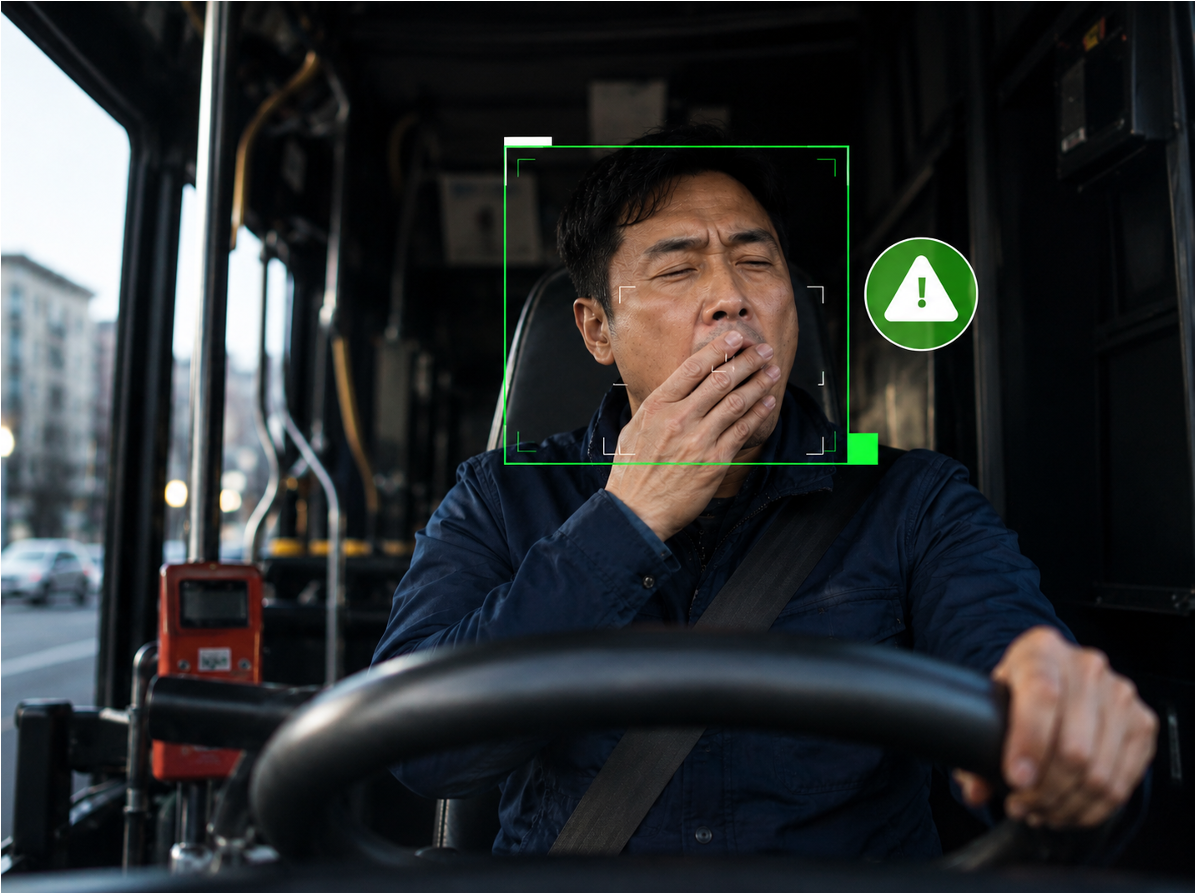
- Internal driver behaviors(drowsiness, distracted driving, cell phone use, etc.) can be detected by AI cameras analyzing changes in the driver's gaze, posture, and facial expressions.
- External vehicle hazards(signal violations, centerline violations, blind spot hazards, etc.) can be detected by AI cameras and vehicle sensors.
- Changes in driving behavior(sudden acceleration, sudden stops, changing lanes, etc.) can be detected with vehicle operation data.
It's not an abstract "safety awareness," it's a visible, data-recorded behavior.
Detected behaviors can be corrected immediately
When a risky behavior is detected, it doesn't mean that an accident will happen immediately. There is a time between detection and accident occurrence. If the driver is warned within that time, the behavior is corrected and the accident is averted.
This simple mechanism - detection → immediate warning → behavior modification - is the key to preventing transportation accidents.
Company awareness and management is the fulfillment of the company's safety management obligations
When a company recognizes, records, and corrects driver behavior, it goes beyond accident prevention to fulfill the company's safety management obligations. The same standard applies to determining whether a company is liable under the Fatal Accidents Act - whether the company could have recognized the risk, and if so, what it did about it,is the key to liability.
A data-documented history of detecting and taking action on risky behaviors is also proof of the company's obligations in the event of an accident. You can read more about the application of the OSH Act to transportation in a separate article.
How AID addresses the behavioral areas accompanying transportation accidents
A.I.Matics' AIDuses AI to analyze accident risk factors inside and outside the vehicle in real time, implementing the detection, immediate correction, and company awareness mechanisms outlined in the previous section into one integrated solution.
Based on data showing that "approximately 98% of accidents are caused by driver inattention," A.I.Matics takes a two-step approach to accident prevention
- First - Immediate driver alerts at the time of the event: delivering real-time warnings to drivers at the onset of risky behaviors such as drowsiness, distracted driving, and cell phone use to intervene just before an accident.
- 2nd - Prevent recurrence through safe driving education: Automatically record and report detected risk events for each driver and utilize them as objective data for driver safety management and education
6 Integrated Functions of AID
AID integrates the following six functions in one vehicle.
- Smart Event Warning - AI detects and warns drivers of major legal violations in real time, such as running a red light, crossing the center line, and reckless driving.
- ADAS Warnings - helps prevent frontal accidents by detecting lane departure, collision risk, and pedestrians in front of you
- Blind Spot Detection (BSD ) - AI accurately detects pedestrians and motorized vehicles in your right and rear blind spots
- AI Video Surveillance Aid Platform - Integrated web-based operations for real-time event viewing, location tracking, and driver score management
- Driver scoring - AI-based driving analysis quantifies driving habits and supports driver management and feedback based on scores
- DTG & e-TAS integration - Automatically save driving records and submit them to the administration to reduce workload
Integrated management of the behavioral areas most often associated with accidents - internal behaviors such as driver drowsiness, distracted driving, and cell phone use, and external risk factors such as signal violations, centerline violations, and blind spots - in one solution.

The difference from traditional FMS-ADAS
A comparison of AID's detection areas with existing solutions utilized in the transportation industry is as follows
| Traffic accident factors | Traditional FMS | ADAS | AID |
|---|---|---|---|
| Speeding, rapid acceleration, rapid deceleration, rapid departure, sudden stop | ○ | - - | ○ |
| Sharp left/right turns, cutting in front, prolonged speeding, sharp turns, continuous driving | ○ | - - - | ○ |
| Poor following distance - Lane violations - Frequent lane changes - Rear-end collisions | - | ○ | Failure to protect pedestrians |
| Violation of pedestrian protection - Rapid route change | - | - - - | ○ |
| Drowsy driving - cell phone use - distracted driving - smoking | - | - - - | ○ |
| Running a red light, crossing the center line, violating a child protection zone, not wearing a seat belt | - | - - - | ○ |
Source: A.I.Matics solution comparison data
In particular, drowsy driving (47.8%) and sudden lane change/reckless driving (33.5%), which account for 81.3% of safety violations, are areas that are difficult to detect with existing FMS-ADAS alone.
Proven effectiveness - Korea Transportation Safety Authority pilot project
Real data, not theory, proves effectiveness.
Here are the results of the AI safe driving pilot project conducted by the Korea Transportation Safety Authority for 500 route buses of 13 transportation companies nationwide for 6 months from June to November 2024.
| Risky driving behavior | Reduction rate |
|---|---|
| Drowsy driving | 99.7% reduction |
| Distracted driving | 93.4% reduction |
| Running a red light | 87.6% reduction |
| Centerline crossing | 46.9% reduction |
| Smoking | 41.4% decrease |
| Not maintaining a safe distance | 32.1% decrease |
| Accident rate (combined) | 55% reduction |
Driver safety score per 1,000 kilometers driven - 50.9 to 76.9 (51.2% improvement)
Significant reductions were seen in areas that corresponded exactly to the accident-causing behavioral structure shown by police statistics. The thesis that accidents are preventableis validated by the data.
Wrapping up - accidents are a matter of management, not luck
To summarize what we've learned so far in one line.
More than half of traffic accidents are caused by safety failures, many of which are objectively detectable driver behaviors such as drowsiness and aggressive driving, and when those behaviors are detected and corrected in real time, accidents are meaningfully reduced.
For fleet owners to move away from vague anxiety about accident prevention, the starting point is to understand with data what behaviors are causing accidents. Once this structure is clear, safety management priorities and safety investments become clear.
Where are my company's accidents happening?
Take a look at how well your company manages the behaviors that accompany accidents with these five items
| Number | Check item | Status |
|---|---|---|
| 1 | Does my organization categorize and aggregate the types of legal violations in incidentsover the past three years? | ⬜ |
| 2 | Do we have a system to objectively detect driver drowsiness, distracted driving, and cell phoneuse? | ⬜ |
| 3 | Are drivers alerted in real timewhen risky driving behaviors occur? | ⬜ |
| 4 | Isdriver-specific risk behavior data automatically recorded and reported? | ⬜ |
| 5 | Is accumulated risk behavior data used for driver training and evaluation? | ⬜ |
If you have fewer than three "yes" answers, your management of accident-associated behaviors may not yet be data-driven. The starting point for accident prevention begins with objective recognition of risky behaviors that co-occur with accidents.
👉 Get an accident risk behavior assessment consultation for your company
Frequently asked questions (FAQ)
H3. Q. What exactly does the statistic of 56% of accidents caused by non-compliance with safety obligations mean?
A. This is the traffic accident statistics by violation of law in 2023 from the National Police Agency Traffic Accident Analysis System (TAAS). When the traffic accidents were categorized by the type of law violation at the time of the accident, 56.1% of the accidents were for failure to obey safety obligations, followed by 13.0% for signal violations and 11.8% for failure to keep a safe distance. In other words, 56 out of 100 traffic accidents were caused by violations of safety obligations.
H3. Q. How does the company objectively detect behaviors such as drowsy and reckless driving?
A. AI cameras are already commercially available that analyze the driver's face, gaze, and posture in real time to detect drowsiness, distracted driving, and cell phone use. The same system can also detect risks outside the vehicle, such as traffic violations and centerline violations. The detected events are automatically recorded in the cloud and can be viewed on the company manager platform.
H3. Q. If I have ADAS, do I need another AI safe driving solution?
A. ADAS is strong at detecting risks outside the vehicle (such as safety distance, lane departure, frontal collision, etc.). However, drowsy driving and reckless driving, which account for 81% of safety violations, are blind spots for ADAS, especially driver internal behaviors (such as drowsiness, distracted driving, cell phone use, etc.). AI safe driving solutions cover areas of driver behavior that ADAS cannot see.
H3. Q. How long does it take to see an impact?
A. Reductions in risky driving behaviors are observed immediately after implementation. Once drivers start receiving real-time warnings, behavioral changes occur quickly. Statistical reductions in the frequency of accidents themselves are typically seen with six months or more of operational data.
H3. Q. My company is small, do we need a solution like this?
A. The structure of incident-accompanied behavior is independent of company size. The fact that more than half of the violations that co-occur with accidents are safety failures applies equally to a company with 5 vehicles as it does to a company with 500 vehicles. Rather, the value of prevention is not proportional to company size, as the impact of a single accident per vehicle is greater for smaller operators.
This article is for general information purposes only. For specific figures, please refer to the latest official data from the source (such as TAAS from the National Police Agency).

