
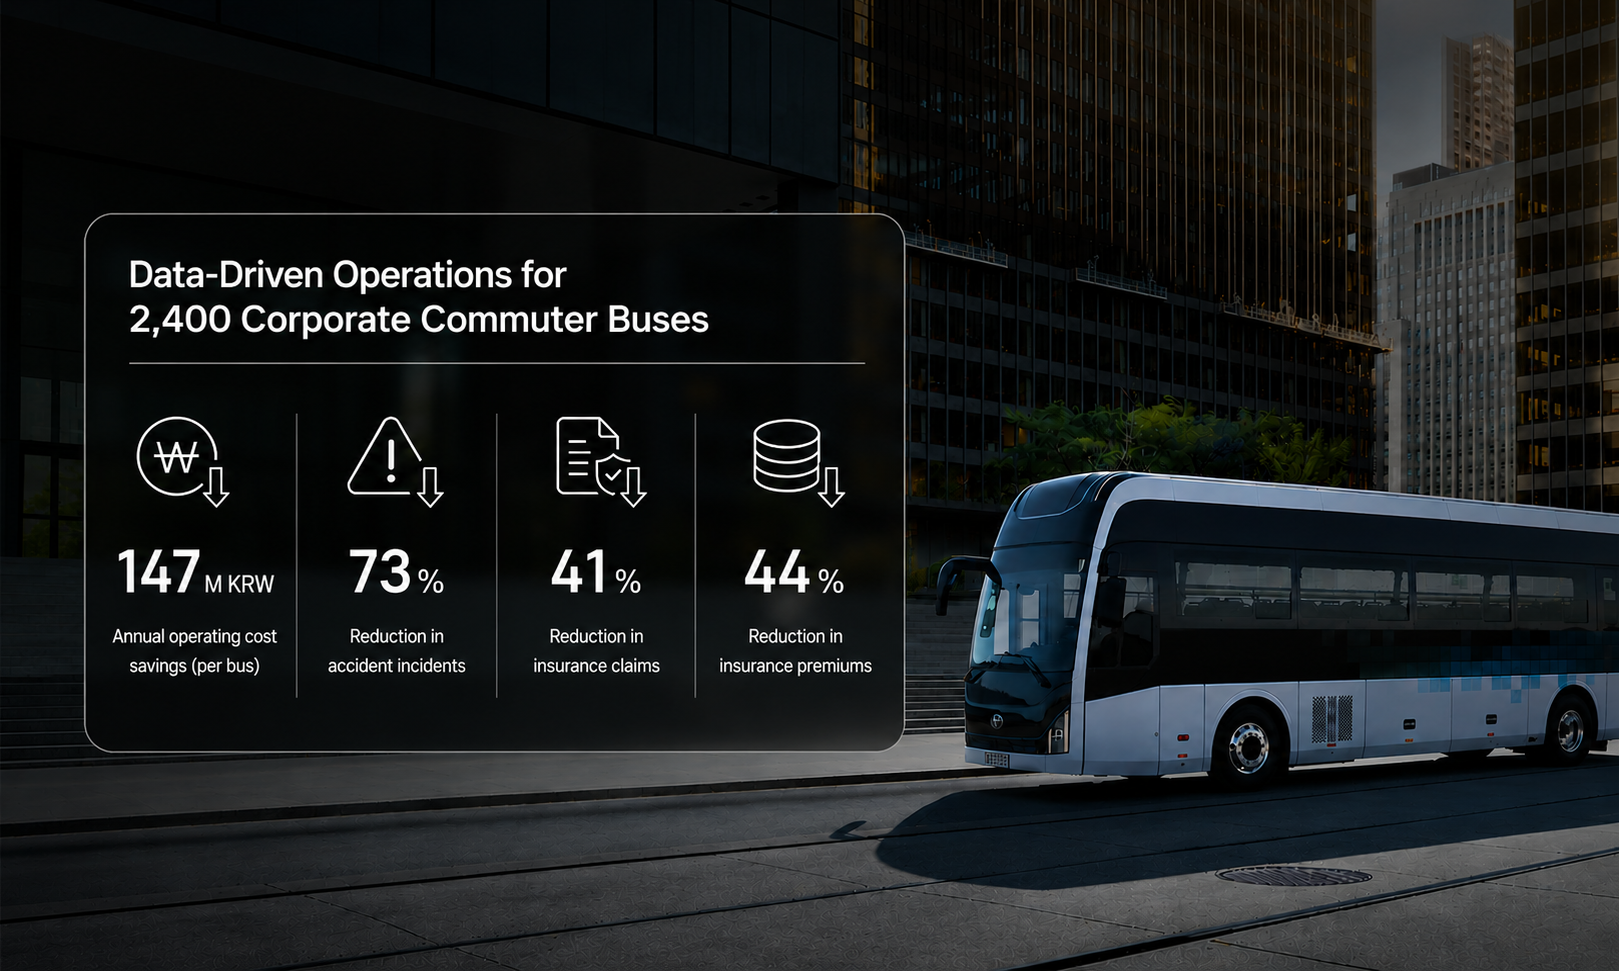
There is one question that HR and general affairs managers at large corporations—who are considering implementing a commuter bus safety management solution—must ask themselves right before making a decision.
"Does it really work?"
"By how much has it decreased?"
"Can our company achieve the same results?"
These three questions must be answered with actual data, not just concepts, features, or review criteria.
Based on a real-world case study of a global semiconductor and electronics manufacturer in Korea—with tens of thousands of employees—that implemented an AI safe-driving solution on approximately 3,000 commuter buses, this article outlines the process from pre-implementation to post-implementation, the results, and whether those results can be replicated by other companies.

Pre-Implementation Situation — Three Limitations of Commuter Bus Safety Management
Before this company considered implementing an AI safety management solution for its commuter buses, it faced the following challenges:
① The Substantive Risk of Commuter Bus Accidents
Approximately 3,000 commuter buses operated daily at a facility employing tens of thousands of employees. In the event of an accident, the financial burden went far beyond mere compensation payments.
- Direct compensation costs: Tens of millions to hundreds of millions of won per accident
- Annual cumulative insurance premiums: In the range of several million won per vehicle
- Increased employee complaints: Accidents lead to internal communication issues and complaints from family members
Our guide to implementing a commuter bus safety management platformdetails the ripple effects a single commuter bus accident can have on the HR and general affairs teams of large corporations.
② Limitations of the Existing Safety Management System
Most commuter buses are operated by contracted transportation companies. While the contracting entity (the large corporation) is assigned safety management responsibilities, the existing structure did not allow it to directly manage drivers’ risky behaviors.
- Requiring safety training from contracted transport companies → Difficult to verify actual compliance
- Securing CCTV footage → Only allows for post-incident review; preemptive intervention is not possible
- Reviewing reports from contracted transportation companies → Aggregated, post-event data does not allow for real-time intervention
- Identifying risk patterns by driver → Difficult to determine how frequently risky behaviors actually occur for individual drivers
③ Uncertainty stemming from “nothing being certain”
The greatest challenge was the lack of objective evidence showing which safety measures actually reduced accidents. Whether we increased safety training hours or strengthened evaluation criteria for contracted transport companies, it was difficult to verify whether these measures were effective in reducing accidents.
Under these circumstances, the following decision was made:
“Let’s manage safety based on data, not intuition.”
Background of the Decision to Adopt — Why an AI Safe Driving Solution?
The company chose an AI safe driving solution over several alternatives for the following reasons.
Alternatives Considered
- Enhancing existing CCTV: Improves post-incident review but does not allow for preemptive intervention
- Strengthening safety training for contracted transport companies: Difficulty in ensuring actual compliance
- Increased Use of DTG Reports: Post-event and aggregated data make it difficult to intervene with individual drivers
- AI Safe Driving Solution: Real-time detection and alerts + automatic data classification and recording
Decisive Criteria
Three conditions were decisive.
- Ability to Intervene Before an Accident Occurs — Detect and Warn of Risky Driving in Advance
- Operates Even Under a Contracted Structure — The client can remotely manage data and events
- Acquisition of Objective Data — Simultaneous collection of evidence for fulfilling safety management obligations and data for accident response
Scale of Implementation
The system was rolled out sequentially across approximately 3,000commuter buses. Through contracts with contracted transportation companies, we established an integrated system for vehicle installation and data management.
Implemented Solution — aid’s Three Core Operating Modes
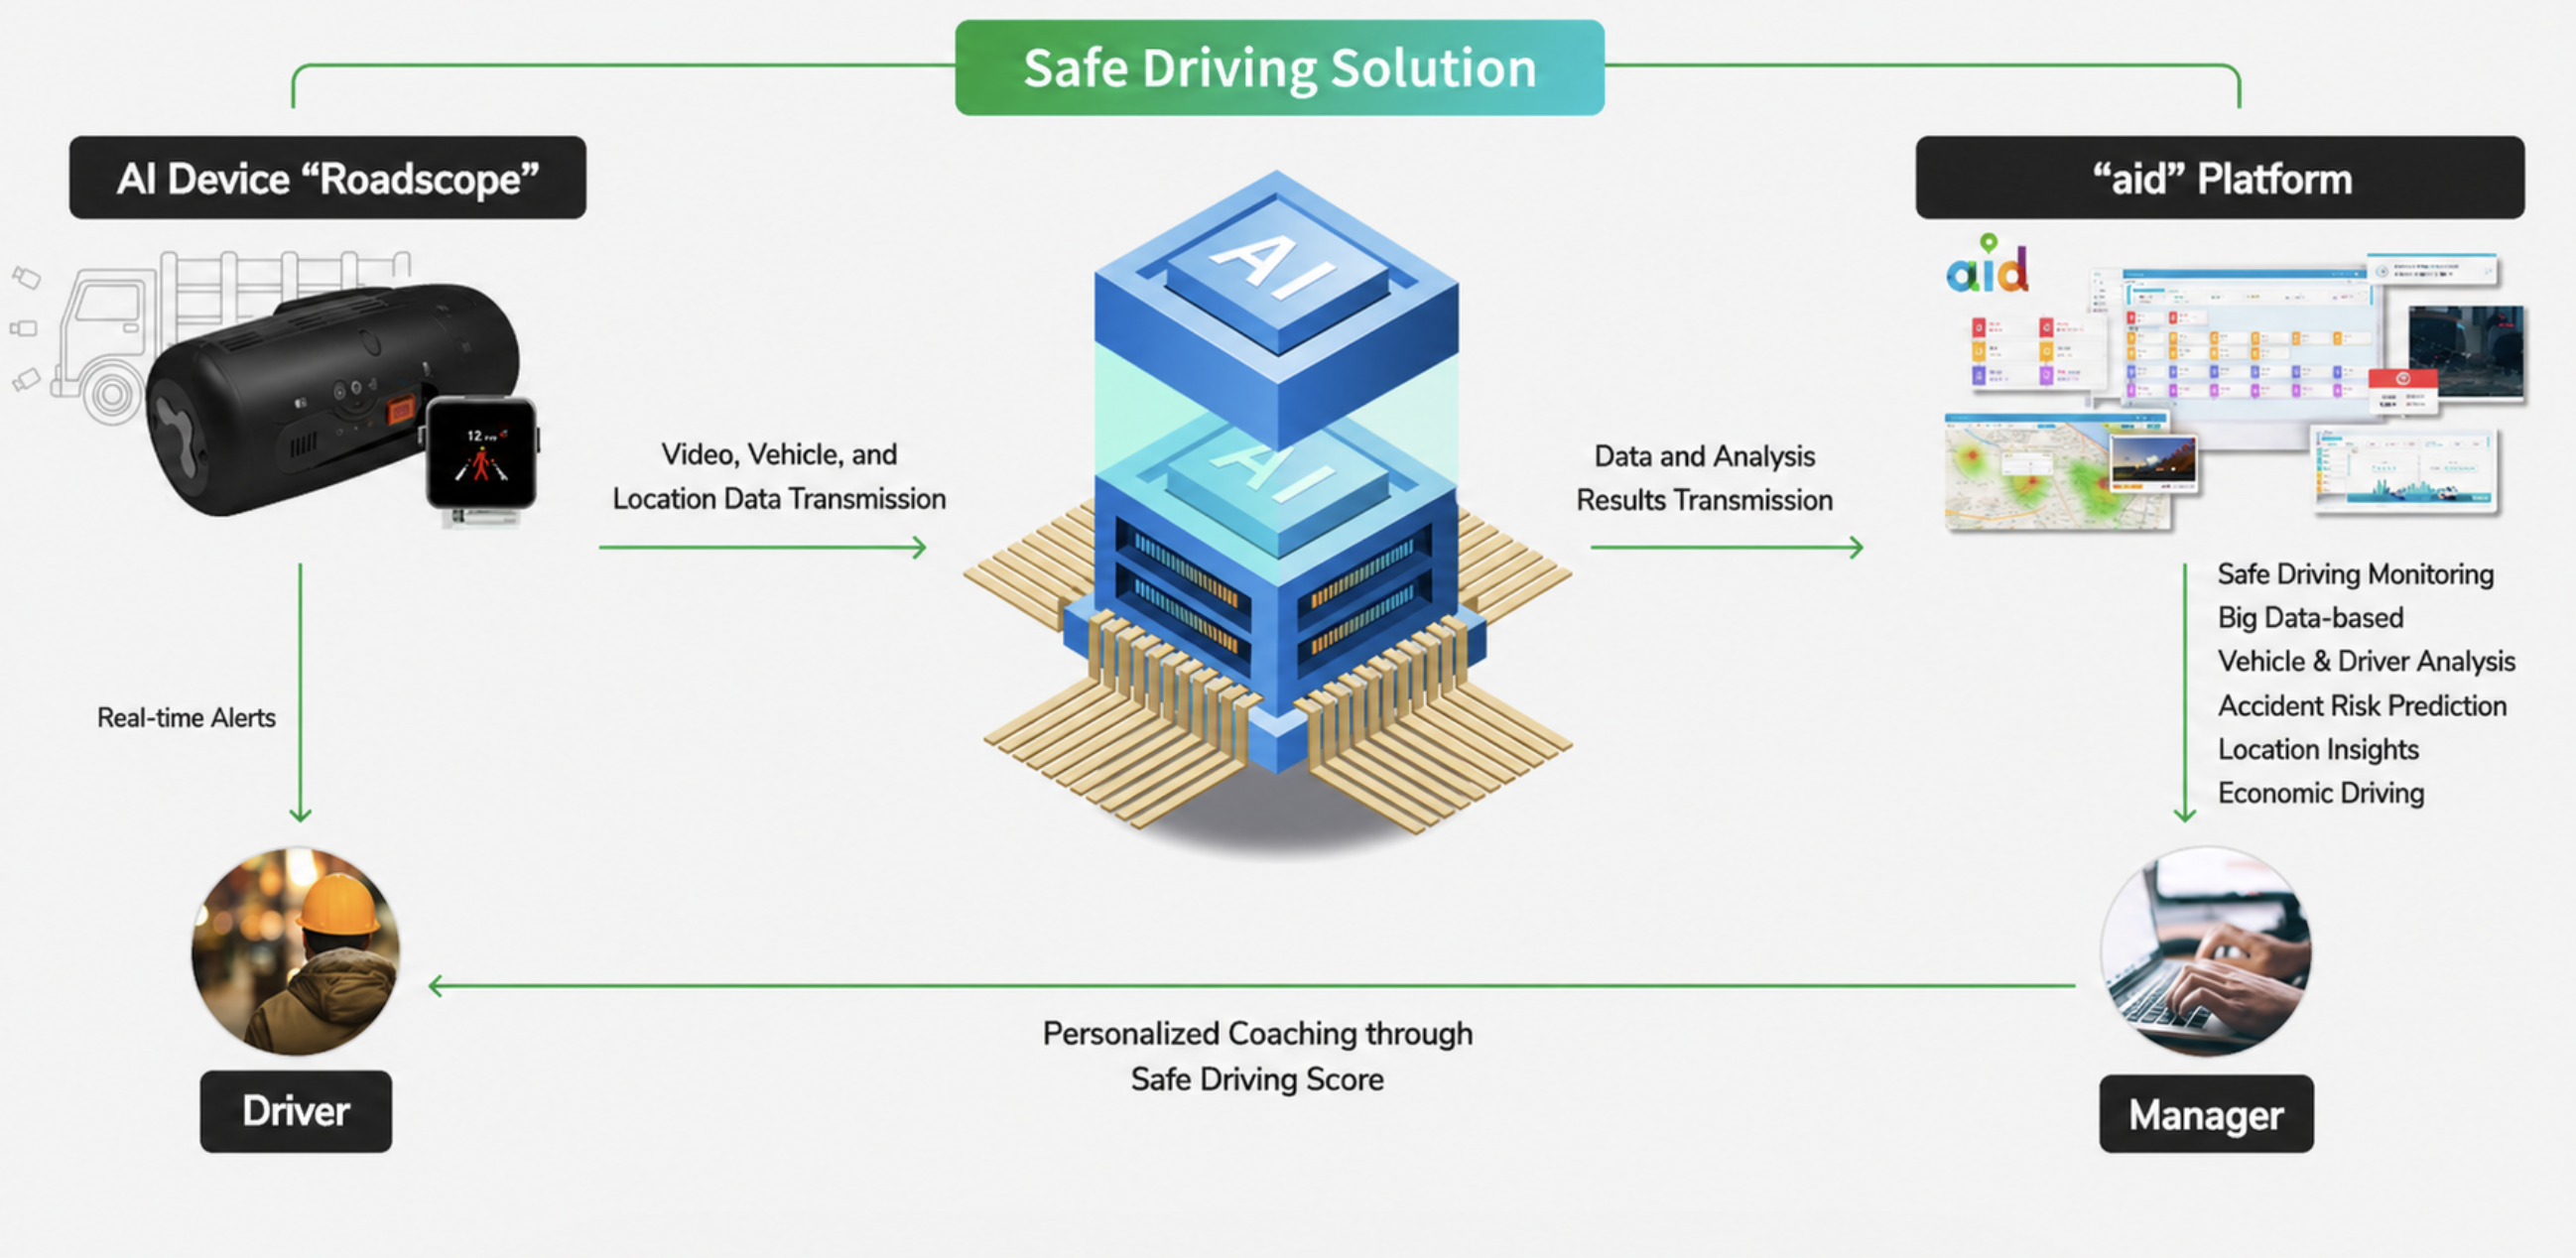
The solution adopted by this company isA.I.Matics’ aid. aid is an integrated solution that uses AI to analyze accident risk factors inside and outside the vehicle in real time, and it operates in three ways corresponding to the aforementioned assessment criteria.
① Real-time Detection and Alerts — Intervention Before an Accident Occurs
AI camerasinstalled in the vehicles monitor the driver’s condition in real time. As soon as risky driver behaviors (DMS, Driver Monitoring System)—such as drowsy driving, failure to watch the road ahead, cell phone use, smoking, or failure to wear a seatbelt—are detected, a voice warningis delivered to the driver to prompt corrective action.
At the same time, external hazards are also detected. When surrounding conditions—such as lane departure, collision risk, pedestrians ahead, or blind spot hazards (ADAS, Advanced Driver Assistance System)—are recognized, an immediate notification is sent to the driver.
② Automatic Data Classification and Recording — Remote Management via a Outsourced Structure
All detected hazardous events are automatically classified and stored. Without the need for manual review of CCTV footage, it is possible to verify, on an event-by-event basis, when, where, and what type of risky driving occurred. The client (a large corporation) can centrally manage data from vehicles operated by contracted transport companies via a remote monitoring platform.
③ Driver-Specific Scoring — Automatic Identification of High-Risk Drivers
Driving behavior data is accumulated for each driver and calculated as a safe driving score. This objectively identifies which drivers exhibit specific risk patterns, serving as evidence of compliance with safety management obligations and providing the basis for tailored training.
As a result of integrating these three operational mechanisms, the following changes were observed.
Post-Implementation Results — Four Verified Changes
The changes observed since implementation are as follows. The figures below are based on an analysis of operational data collected over a specific period following implementation, covering a fleet of approximately 2,400 commuter buses. They were calculated by comparing pre- and post-implementation data; detailed information on actual implementation cases can be found in the A.I.Matics Commuter Bus Use Case.
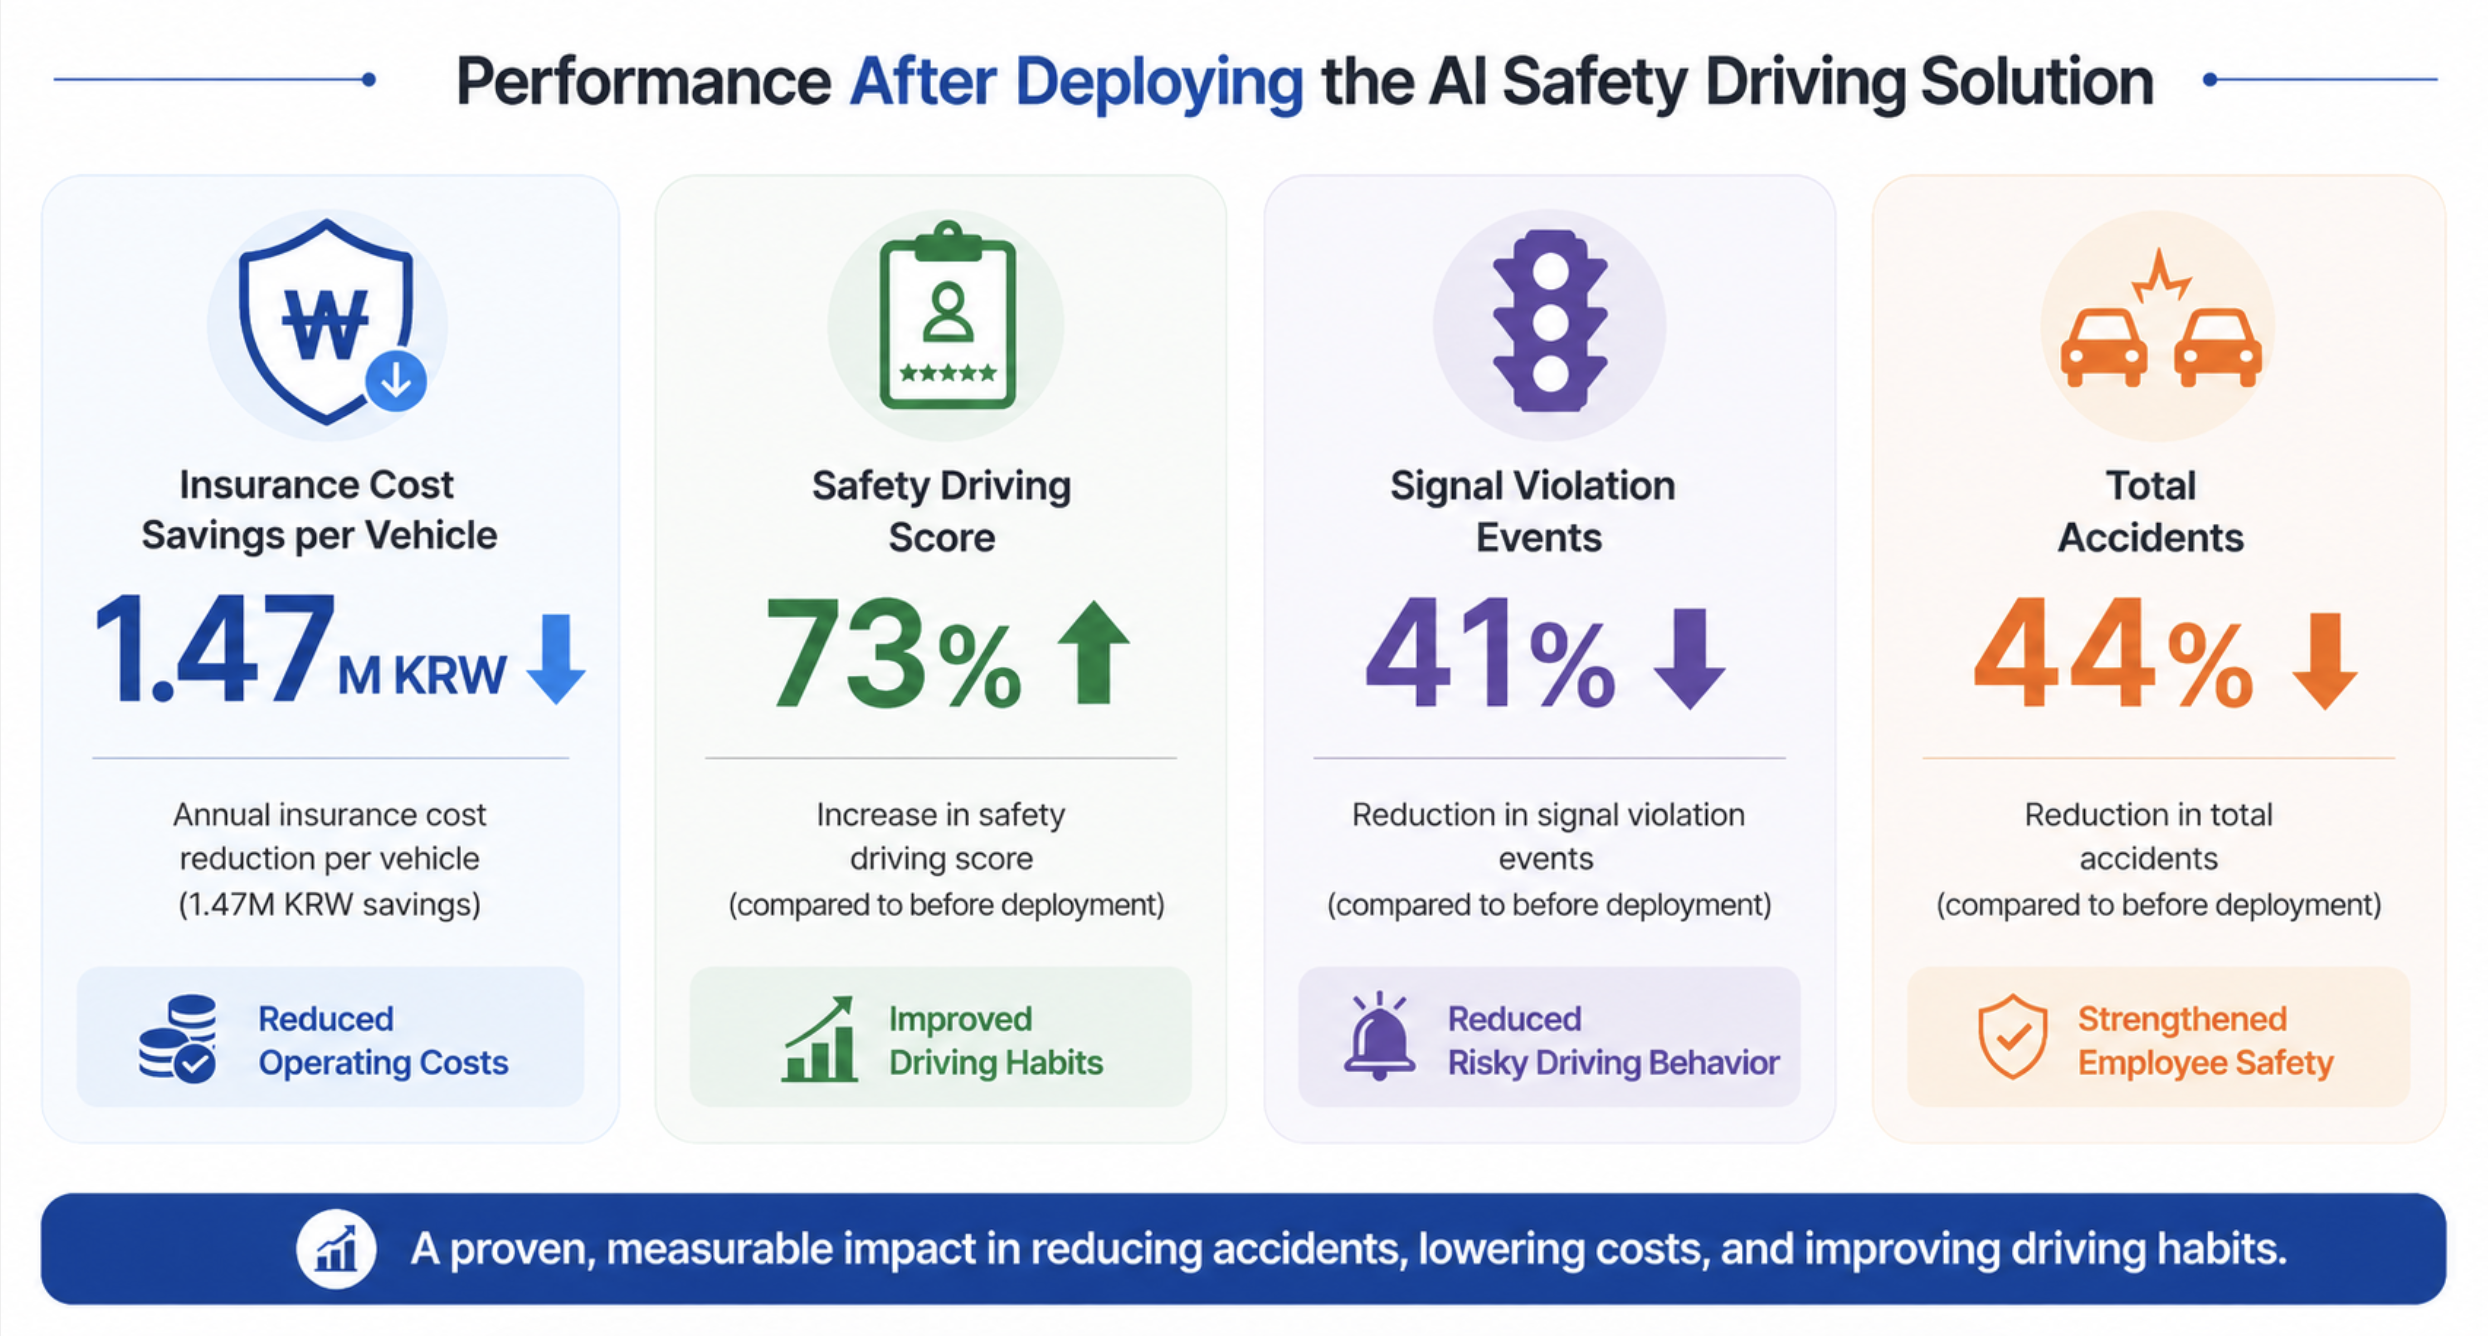
① Insurance premiums decreased by approximately 1.47 million won per bus (68%)
Annual insurance premiums per bus decreased by 68%. In absolute terms, this amounts to approximately 1.47 million won per bus. This represents a significant cost savings even based on the sample size of approximately 2,400 buses used for measurement; the annual savings would be even greater if scaled up to the total fleet size of 3,000 buses.
This result is a natural consequence of the overall decrease in accidents. The long-term cumulative effect—fewer accidents → fewer claims → improved insurance premium calculations—has taken hold.
② Safe Driving Score: 50.9 → 76.9 (73% increase)
The averagesafe driving score per driver rose from 50.9 to 76.9 points, representing a 73% increase . The driver scoring system is a value derived from A.I.Matics’ proprietary, data-driven program, which quantifiesand synthesizes driving behavior patterns.
This increase occurred for two reasons.
- Real-time Alerts: Voice alerts are issued to drivers immediately upon detecting risky driving behavior, encouraging corrective action.
- Score-Based Feedback: As individual scores are publicly tracked over time, rewards and training motivate drivers to improve voluntarily
③ 41% Reduction in Traffic Light Violations
Traffic signal violations decreased by approximately 41%. Since traffic signal violations are the leading cause of the most severe types of commuter bus accidents (passenger injuries and vehicle-to-vehicle collisions), the reduction in this metric served as a leading indicator of a decrease in accidents.
④ 44% reduction in total accidents
Since the introduction of the AI safe driving solution, the total number of accidents has decreased by approximately 44%. This figure is based on the business division’s internal analysis; it is the most direct indicator within the commuter bus sector and has a decisive impact on employee safety.
The key to this result is thatthe four metrics are interconnected. It creates a virtuous cycle in which real-time alerts improve driving behavior, safety scores rise, traffic signal violations decrease, and, as a result, both accidents and insurance claims decline.
What the Results Reveal — 5 Key Takeaways
The implications of this case study for other companies reviewing their commuter bus safety management are as follows:
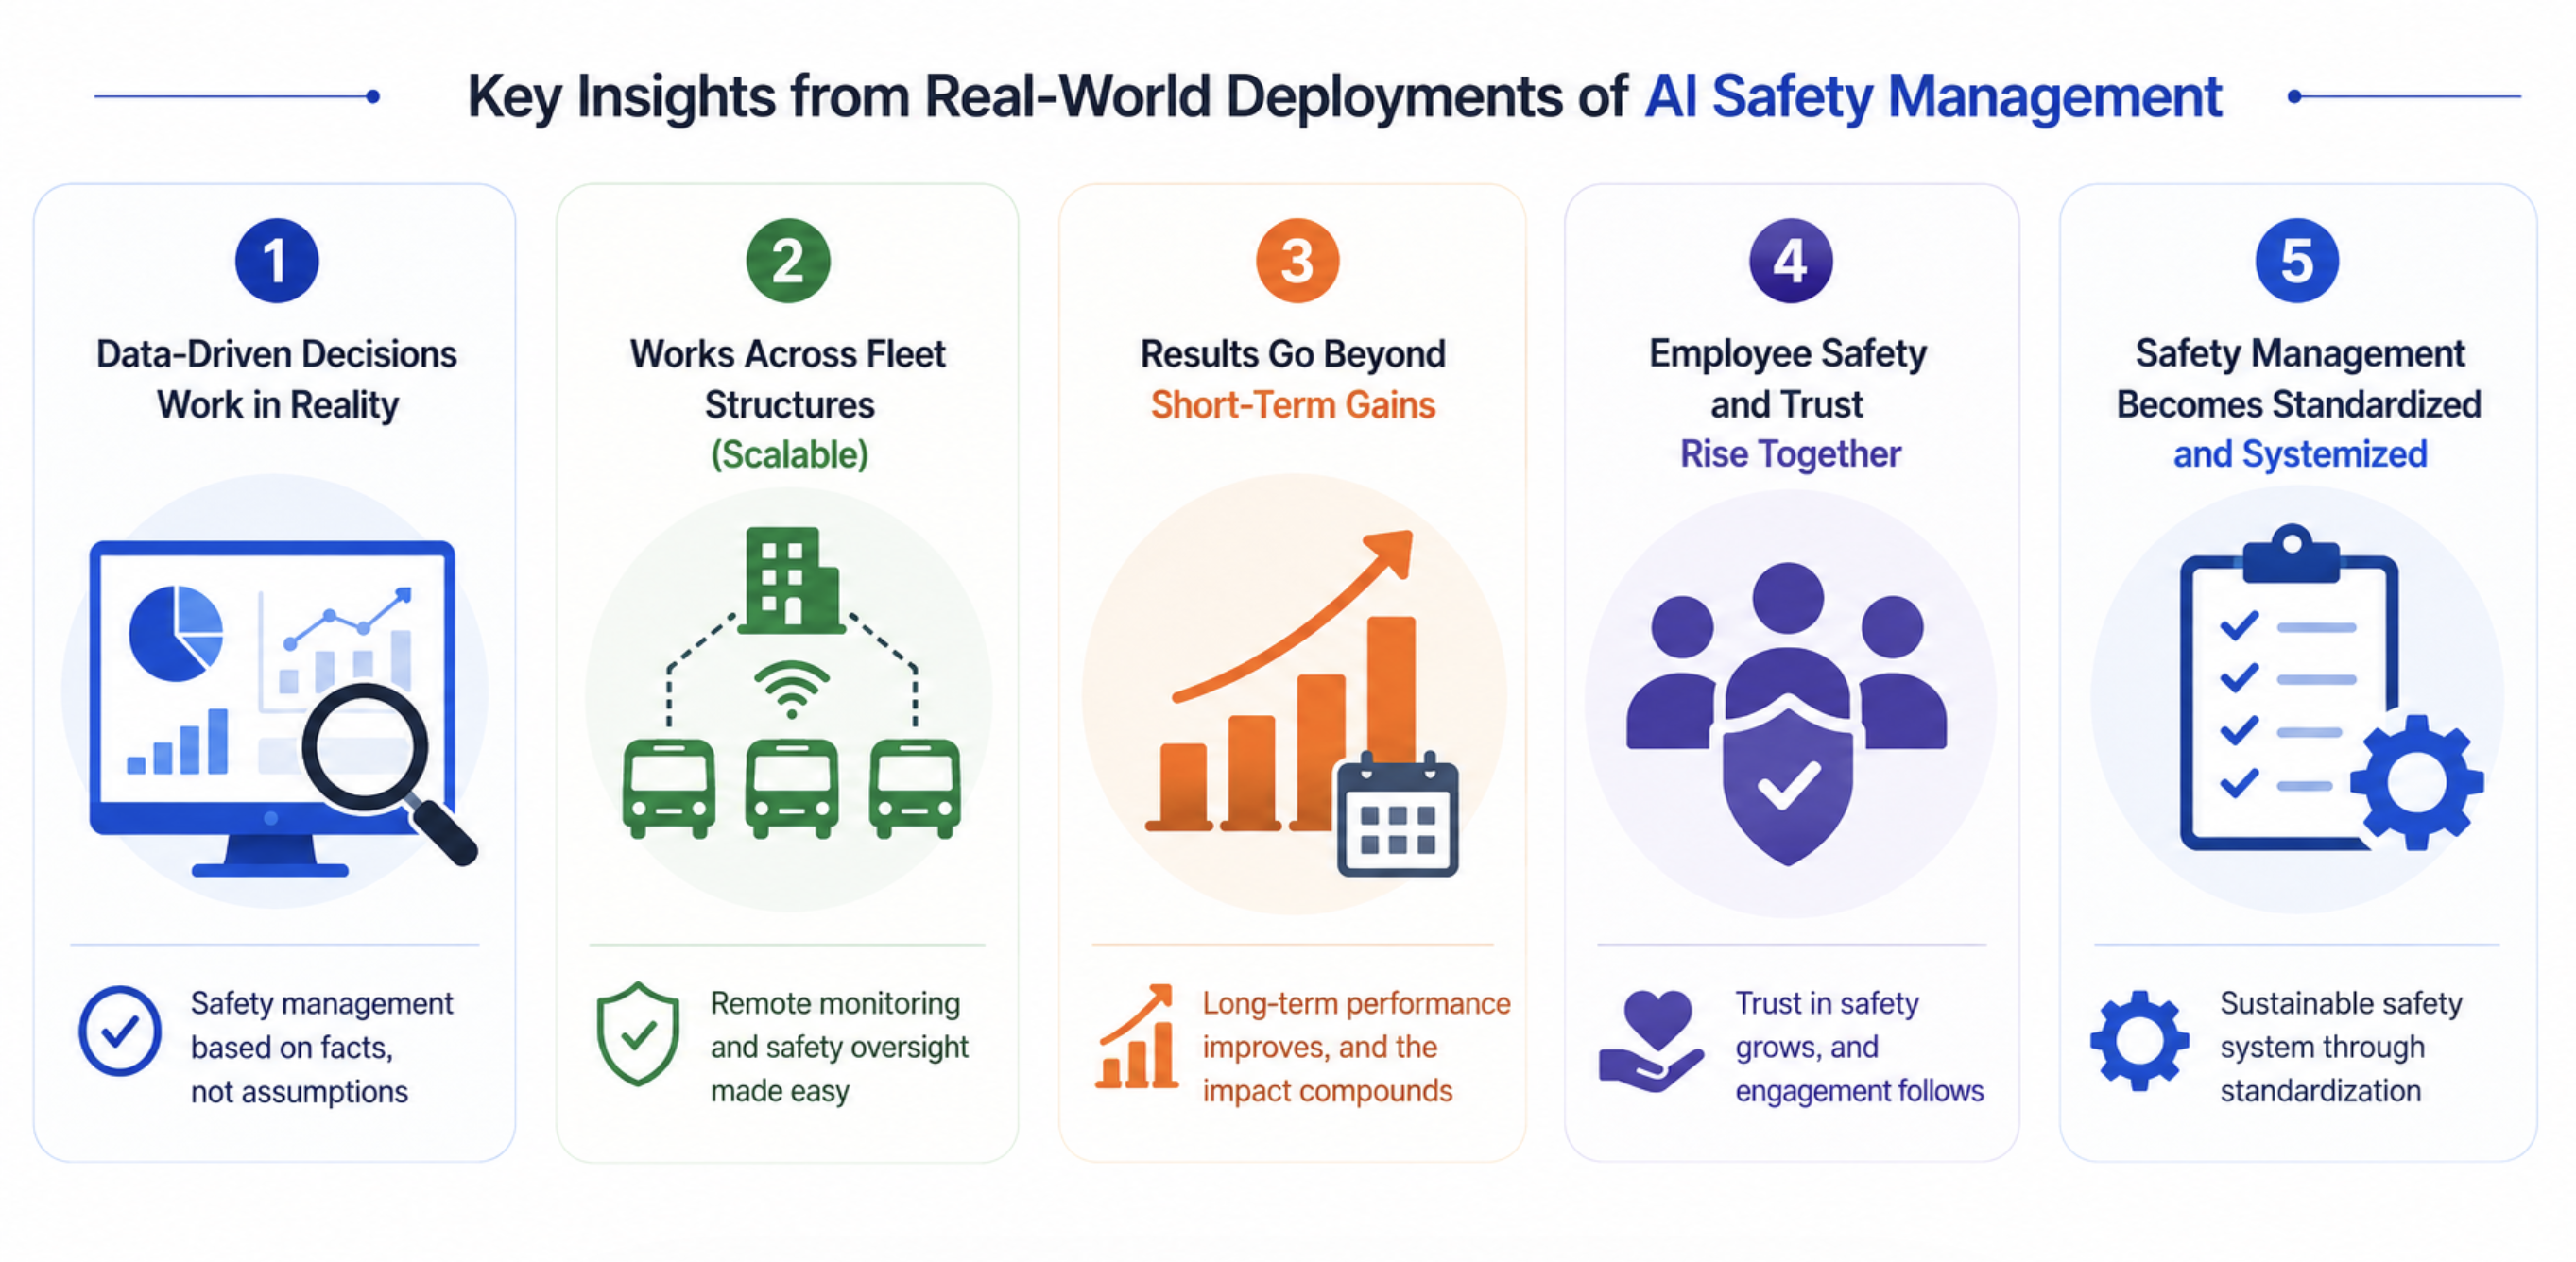
① Data-driven decisions actually work
The previous uncertainty—such as “I’m not sure if increasing safety training hours will be effective”—was resolved by shifting to data-driven management. When real-time detection, automatic logging, and driver scoring are integrated, it becomes possible to objectively verify which interventions actually reduce accidents.
② It works even in a subcontracting structure
Most commuter buses are operated by contracted transportation providers. This case demonstrates that the contracting entity (a large corporation) can remotely manage data and events even whenit does not operate the service directly. While it is not possible to enforce compliance without the cooperation of the contracted carrier, including the use of safety management solutions in the contract terms allows the client to secure evidence of compliance with its safety management obligations.
③ Effects Accumulate Over Multiple Years
While a reduction in accidents and insurance claims is evident in the first year, the true benefits accumulate over several years. As risk pattern data for individual drivers accumulates, customized training becomes more refined, and as accident records improve, insurance premium calculations become more favorable. The cumulative benefits 3 to 5 years after implementation significantly exceed the initial implementation costs.
④ Employee safety index and trust rise together
Although this is an area that is difficult to quantify, employees’ confidence in their commuting safetyincreases. This, in turn, impacts working conditions, perceptions of employee benefits, and hiring competitiveness at large workplaces. Considering the ripple effect that a single commuter bus accident can have on internal social media and family communications, this intangible value is also significant.
⑤ Evidence of compliance with safety management obligations is secured
Amid a trend toward stricter regulations regarding safety management obligations—such as the Act on the Punishment of Serious Accidents and the Occupational Safety and Health Act—a system is established that allows companies to demonstrate compliance with these obligations using objective data. When determining whether a company has fulfilled its safety management obligations following an accident, companies with data and those without find themselves in completely different positions.
Can our company achieve the same results?
For the results of this case study to be replicated by other companies, the following three conditions are necessary.
Condition for Success ① — A Collaborative Structure with Contracted Transportation Providers
Even if the client decides to implement a safety management solution, the actual vehicle installation and data utilization must be carried out in collaboration with the contracted transportation provider. It is crucial to specify the use of the safety management solution at the contract stage and to agree in advance on procedures for data sharing and incident response.
Condition for Success ② — Driver Communication
AI-powered safe driving solutions detect and alert drivers to risky behavior in real time. In the early stages of implementation, drivers may feel as though they are being monitored. To overcome this, a system of score-based feedback, recognition of improvements, and rewardsmust be designed in tandem. The 73% increase in the safe driving score in the case study was made possible precisely because this communication strategy was effectively implemented.
Success Factor ③ — Utilizing an Integrated Management Platform
Simply installing the system in vehicles is not enough to achieve these results. The five key lessons learned can only be replicated when a platform that integrates real-time events, driver scores, vehicle locations, and accident response datais fully operational. The integrated operation of the AI safe driving solution and the monitoring platform is crucial.
Summary — Commuter Bus Safety Management: “Based on Data, Not Gut Feel”
To summarize the points discussed so far in a single sentence:
In a case study involving the deployment of approximately 3,000 commuter buses for a global semiconductor and electronics manufacturing company in Korea, a 68% reduction in insurance claims, a 73% increase in safe driving scores, and a 44% decrease in accident rates were confirmed for the 2,400 buses used as the benchmark. These results can be replicated when data-driven safety management, collaboration with contracted transportation providers, and an integrated management platform work together.
Commuter bus safety management is now moving beyond simply “doing something” and entering the realm of “proving results with objective data.” The path to simultaneously ensuring employee safety and fulfilling the company’s safety management obligations is becoming increasingly clear.
Request a consultation or demo on implementing AI-powered commuter bus safety management
Frequently Asked Questions (FAQ)
Q. Aren’t these results only achievable under specific conditions?
A. Absolute figures may vary depending on the scale of implementation, industry, and operational structure. However, the fundamental mechanism for reducing risky driving (real-time alerts → behavioral correction → accident reduction) works regardless of vehicle type or scale. A pilot project conducted by the Korea Transportation Safety Authority on 500 route buses confirmed a 99.7% reduction in drowsy driving, a 93.4% reduction in failure to maintain forward attention, and a 55% reduction in the overall accident rate, verifying the reproducibility of this mechanism.
Q. Isn’t it difficult to implement the system if the contracted transportation company does not cooperate?
A. The most effective approach is to explicitly stipulate the use of safety management solutions in the contract terms. Since contracted transport companies also benefit from improved safe driving scores, reduced accidents, and lower insurance premiums, establishing a collaborative framework is not difficult once the initial persuasion phase is over. If it is difficult to secure cooperation from contracted carriers, a practical approach is to start with a pilot implementation on a test route, share the results, and then expand the program.
Q. What is the payback period relative to the implementation cost?
A. It depends on the scale of implementation, the company’s existing accident history, and its insurance premium levels. In the case study mentioned, the payback structure was confirmed to exceed the implementation costs through insurance savings alone; when intangible benefits such as reduced accidents and proof of compliance with safety management obligations are included, the payback period is further shortened. An accurate payback scenario is calculated through individual consultations.
Q. How are employee personal information and privacy issues managed?
A. The AI safe driving solution detects and records the driver’s driving behavior (such as sudden acceleration, sudden braking, eye movements, and posture). It does not collect passengers’ personal information, and all related data—including in-vehicle video footage—is strictly protected and managed in accordance with relevant laws and regulations, such as the Personal Information Protection Act. It is standard practice to design detailed policies—including data access permissions, retention periods, and scope of use—in collaboration with contracted transportation companies and departments responsible for personal information during the implementation phase.
Q. How long after implementation will results become apparent?
A. A reduction in risky driving behaviors is observed immediately after implementation. Once drivers begin receiving real-time alerts, behavioral changes occur rapidly. Statistical validation of the reduction in accidents generally becomes clear after 6 months to 1 year, and the savings on insurance premiums accumulate over several years.
Q. Our company has fewer than 100 commuter buses. Is it still worth implementing?
A. It is worthwhile even for small-scale operations. The repercussions of a single commuter bus accident—including compensation, media coverage, employee trust, and proof of compliance with safety management obligations—are significant regardless of the company’s size. For smaller companies, a phased approach—starting with a pilot program, followed by data analysis, and then gradual expansion—is practical. Furthermore, the collaborative structure with contracted transportation providers can actually be designed more flexibly for smaller operations.
This article is based on data from actual implementation cases. Results may vary by company depending on size, industry, operational structure, and the nature of the collaboration with the contracted transportation provider. A thorough evaluation of implementation should be conducted through consultation tailored to your specific conditions.

